Table of Contents
Use OptionsPro Plugins in ChatGPT
Our OptionsPro plugin, when activated and used within ChatGPT, will provide an extremely convenient user experience. Unlike traditional web platforms that require reading through complex tutorials, within ChatGPT, you can directly ask questions like:
• How do I use the OptionsPro plugin? Can you provide me with some common examples?
• Should I sell my stock ABC? Show me the price resistances and supports?
• I am going to YOLO stock ABC, can I?
• What is the market outlook today?
• Can you show me the most traded options for today?
• Can you show me the intraday Gamma plot for SPX 0DTE options so far today?
• Are there any significant shifts in the investor sentiment?
• Are there any notable trends or patterns in the Gamma Distribution for stock ABC's options?
• Show me all top historical trades for stock ABC's options with strike 310?
• What is the trend of the VIX recently, any indication of a upcoming spike?
• Are there any important economic events I should be aware of?
• ...?
There are hundreds of prompts available for you to explore. Leveraging the robust data provided by the OptionsPro model, in conjunction with the capabilities of ChatGPT, you are free to exercise your creativity, while securing professional support for your investments and financial management. Furthermore, the multilingual capabilities of ChatGPT enable you to post in various languages and receive responses in the same language, enhancing the user experience.
Please refer to the video below for more information. Again, do not limit your imagination. Ask anytime, anywhere. OptionsPro is always there to provide you with reliable data.
End-of-Day Market Sentiment Index
Our unique tool, the Market Sentiment Index (MSI), is like a mood ring for the stock market. Our sophisticated machine learning models compute the MSI by analyzing various factors such as market price action, volatility smile, term structure, volatility surface, options trading activity, and more. The MSI can be in one of three states, each showing a different market mood. It works together with another indicator, the Volatility Index (VIX), which tells us how much price fluctuation people expect in the market. Here's how we can understand the MSI states:
The MSI fluctuates around zero, staying within a range of ±1.0. It's as if the market is uncertain about its direction:
- The VIX is DECAYING: Counterintuitively, the market will slowly rise despite the presence of uncertainty, as people have effectively hedged against potential risks.
- The VIX hovers around VIX_SMA: There is no room left for further VIX decay, and the market could be due for a sudden technical correction. During these times, it's wise to proceed with caution, for example, by setting a stop-loss order or using options to hedge positions.
A typical metastable phase is shown below:The MSI is negative (e.g., <-1), people feel pessimistic about the market:
- The VIX is SURGING: It is no surprise that the market will be in a downtrend for a while, accompanied by the MSI becoming increasingly negative.
- The VIX is HIGH but likely to DECAY: If MSI is pretty negative (e.g., MSI < -6), it could lead to a sudden shift in market sentiment, potentially triggering a short squeeze and causing rapid price increase.
A typical negative phase is shown below:The MSI is positive (e.g., >1), people feel optimal about the market:
-The VIX is DECAYING: After a rapid decline and bounce, the market sentiment transitions quickly to optimism, with smart money buying the dip. However, no sharp bounce is expected anymore since the market has settled.
-The VIX hovers around VIX_SMA: Market have been settled for a while (for instance, when the MSI is > than 3), there might be a sudden drop in prices. As the MSI decreases, the market status transitions into the Metastable or Negative region.
Market sentiment statuses cycle periodically and drive changes in the entire market. The key idea behind all this is mathematically dense but can be intuitively understood through something called reflexivity. Imagine you're at an auction, and everyone seems to want the same painting. You might start to think it's valuable and want it too, driving the price even higher. That's reflexivity — people's beliefs influencing the market, and then the market reinforcing those beliefs. It can make prices go up quickly, but if it goes too far, prices might suddenly drop.
To gain access to comprehensive real-time intraday MSI data and more detailed information, we highly recommend considering a premium subscription. As valued users, a premium subscription will provide you with the tools and resources necessary for enhanced trading analysis and decision-making.
Intraday Market Sentiment Index
The MSI Intraday Chart is a valuable tool we provide for options traders, offering real-time insights into market sentiment and accurately sensing the flow of smart money within the intraday timeframe. The explanation of the Metastable/Positive/Negative regions of the end-of-day (EOD) MSI on the home page can be applied to the intraday MSI as well. In addition to this, certain guidelines are provided based on the color of the Bollinger Band:
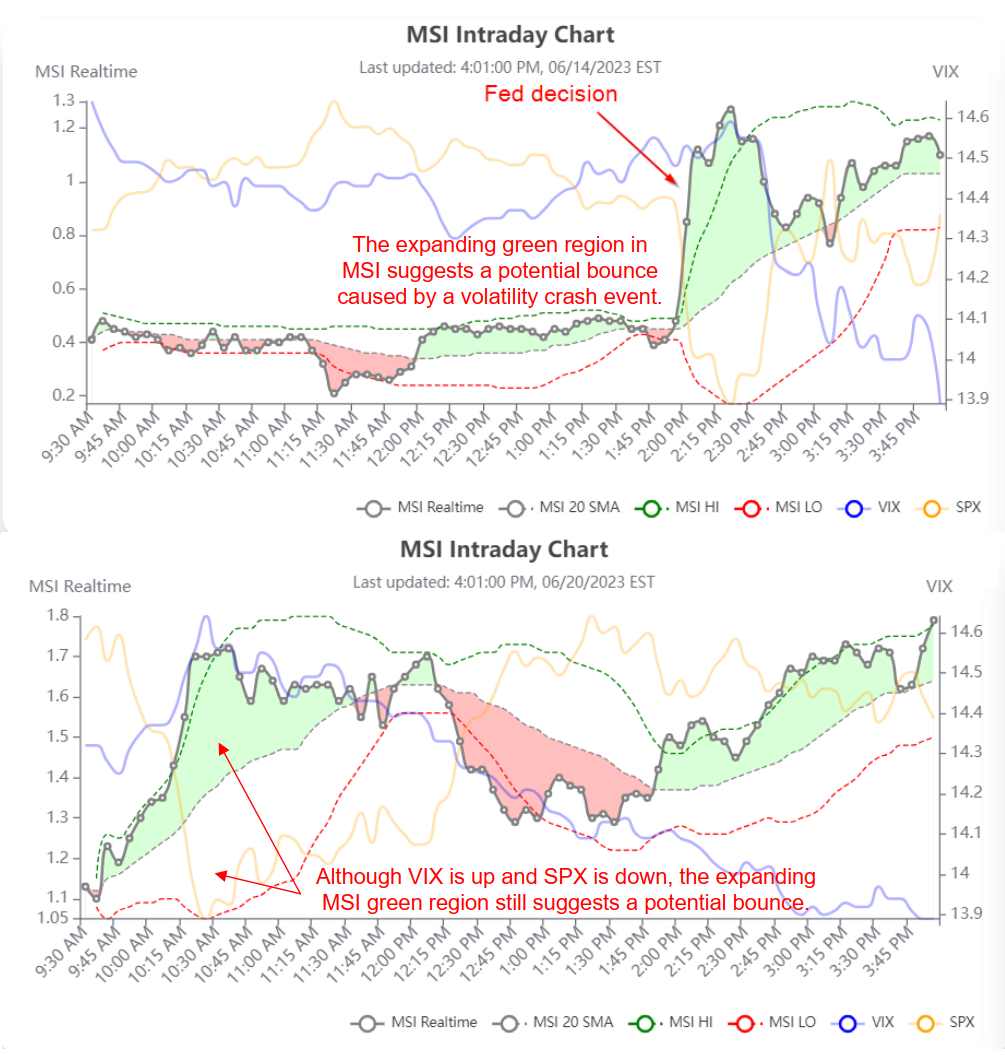
- In the intraday-MSI chart, when the green region is EXPANDING or the red region is SHRINKING, it signifies an optimistically confident market mood, and the market may be in an uptrend, potentially testing the resistance levels, even if the SPX price continues to decrease. A bounce within an expanding green region represents a valid entry point for a long position.
Two typical green regions are shown below:
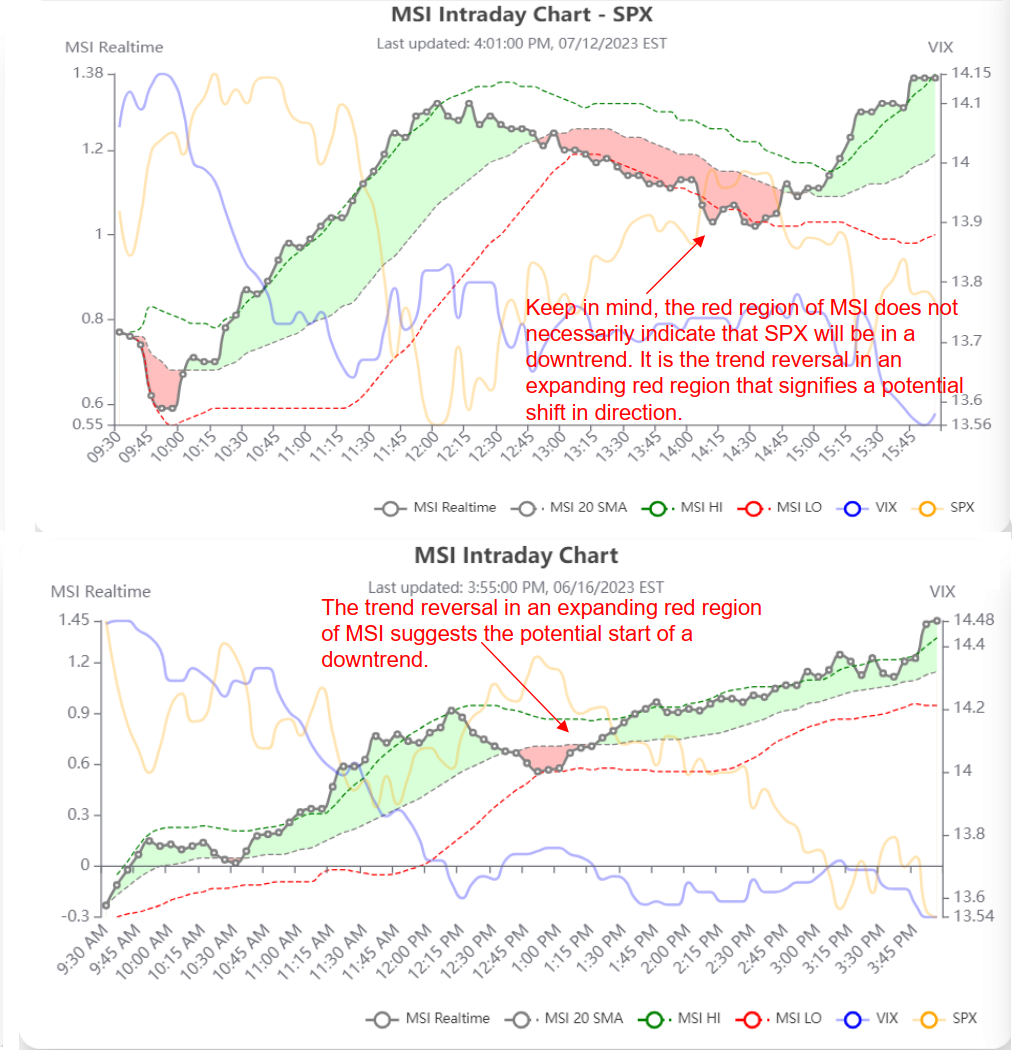
- In the intraday-MSI chart, when the red region is EXPANDING or the green region is SHRINKING, it suggests a pessimistically suspicious market mood, potentially signaling an impending trend reversal, even if the SPX price continues to increase. A downward trend reversal within an expanding red region represents a valid exit point for a long position.
Two typical red regions are shown below:
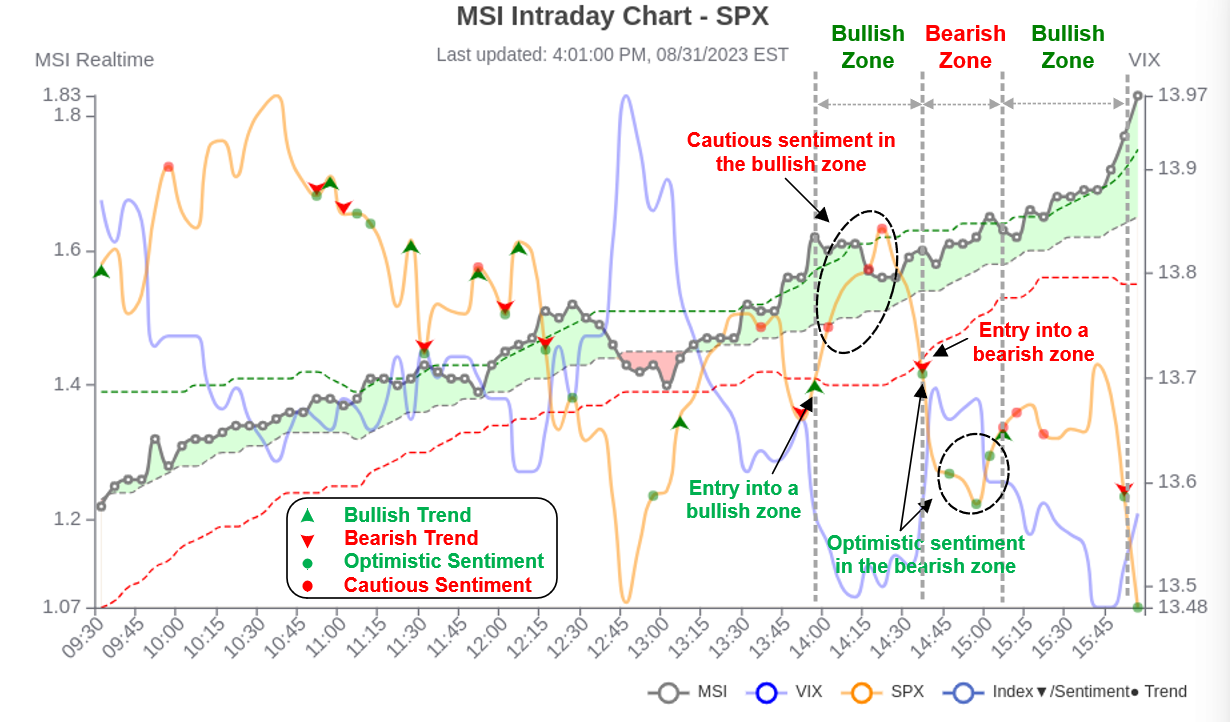
To enhance user comprehension of market trends, we have integrated two distinct trend analyses in this section: index trends and sentiment trends. For a more vivid representation, we have embellished the graph with corresponding markers, along with a succinct summary table highlighting the 10 most recent analysis results. The specifics are detailed below:
- - Green upward triangle: Indicates entry into a bullish zone
- - Red downward triangle: Indicates entry into a bearish zone
- - Green circle: Represents optimistic sentiment during a downward trend
- - Red circle: Represents cautious sentiment during an upward trend
- - No circle: Signifies market sentiment in agreement with the trend
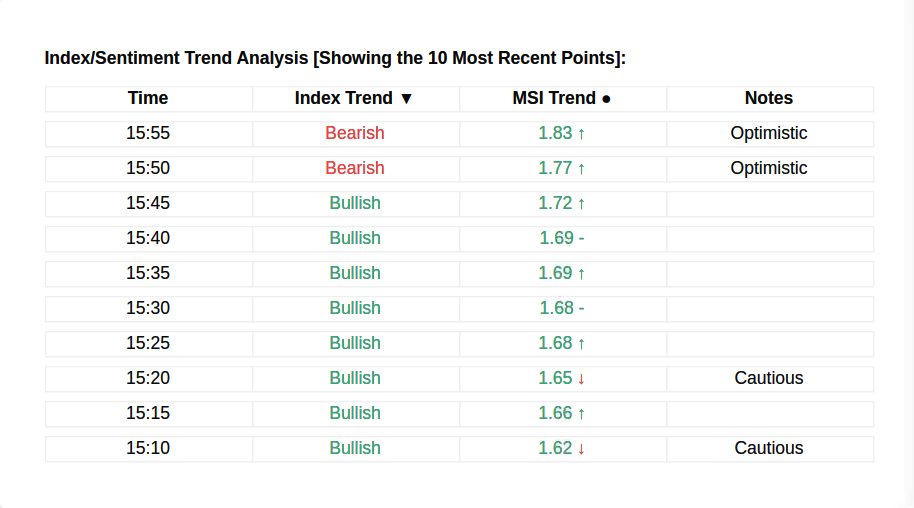
- - Green value: MSI is greater than or equal to the average
- - Red value: MSI is less than the average
- - Green upward arrow: MSI has increased compared to the previous time period
- - Red downward arrow: MSI has decreased compared to the previous time period
The index trend is generally a laggy indicator, while the market sentiment, being derived in the high-order space, takes a while to permeate the market, thus it usually serves as a leading indicator. By combining these two indicators, we can formulate various strategies. For instance, the simplest and most direct example would be to opt for selling a put during a bearish phase if optimistic sentiments appear consecutively, or choosing to sell a call during a bullish phase if cautious sentiments appear consecutively (Do not over-short the market, as a short squeeze may sometimes occur in such cases.).
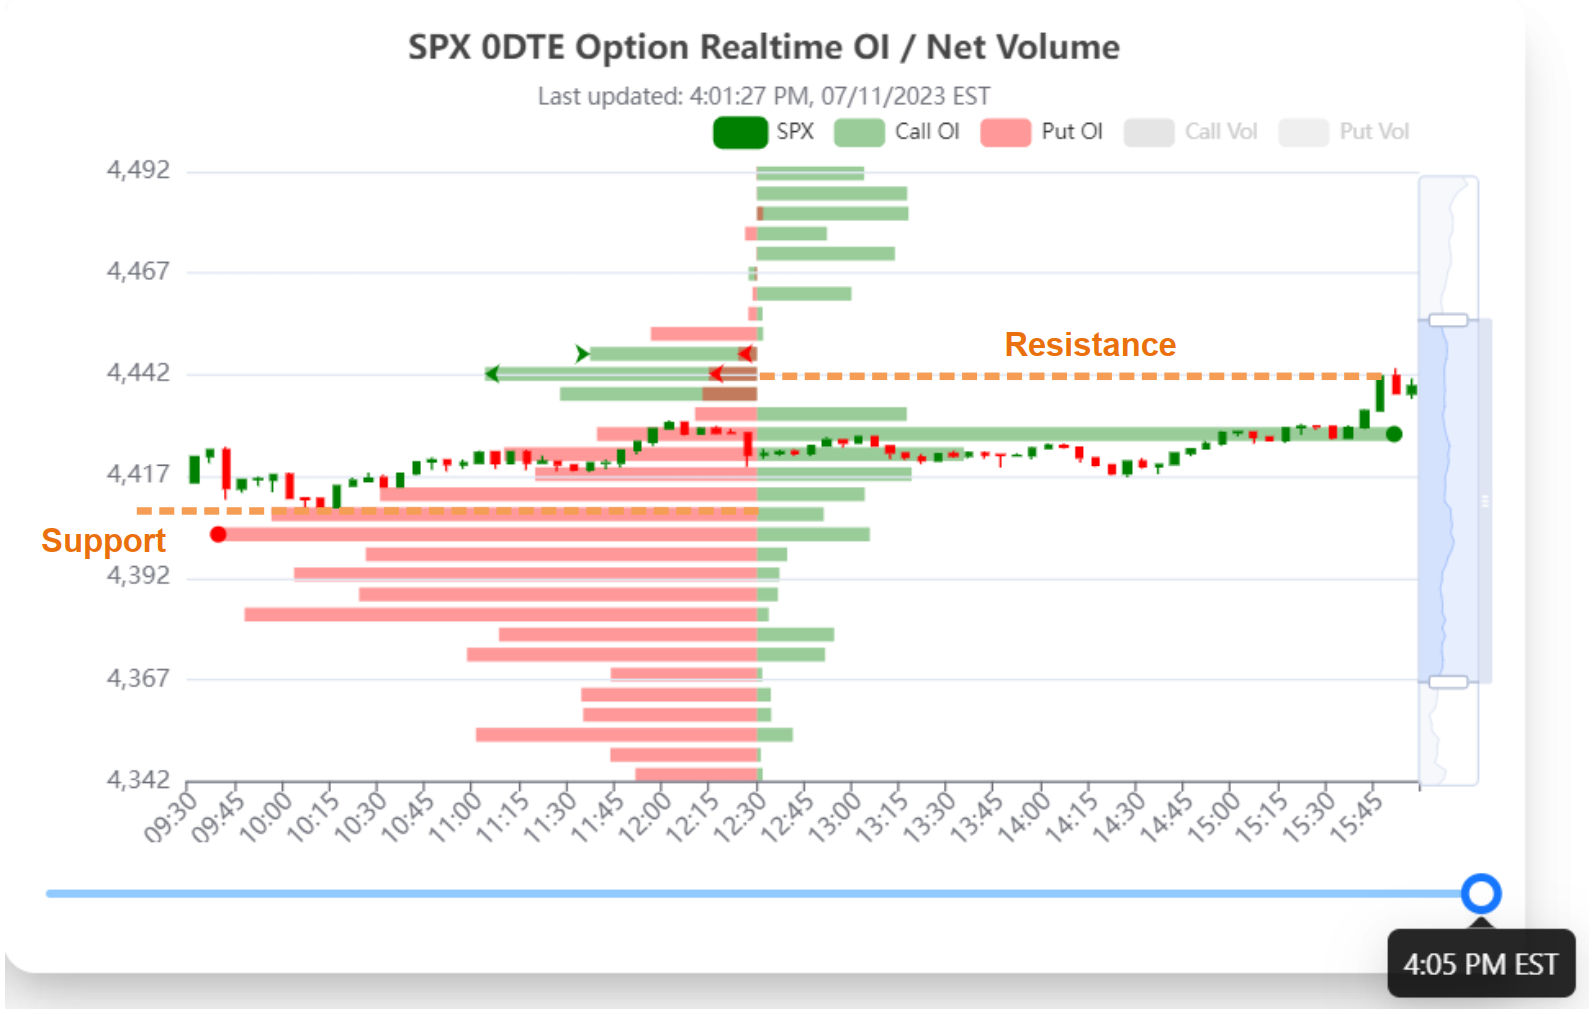
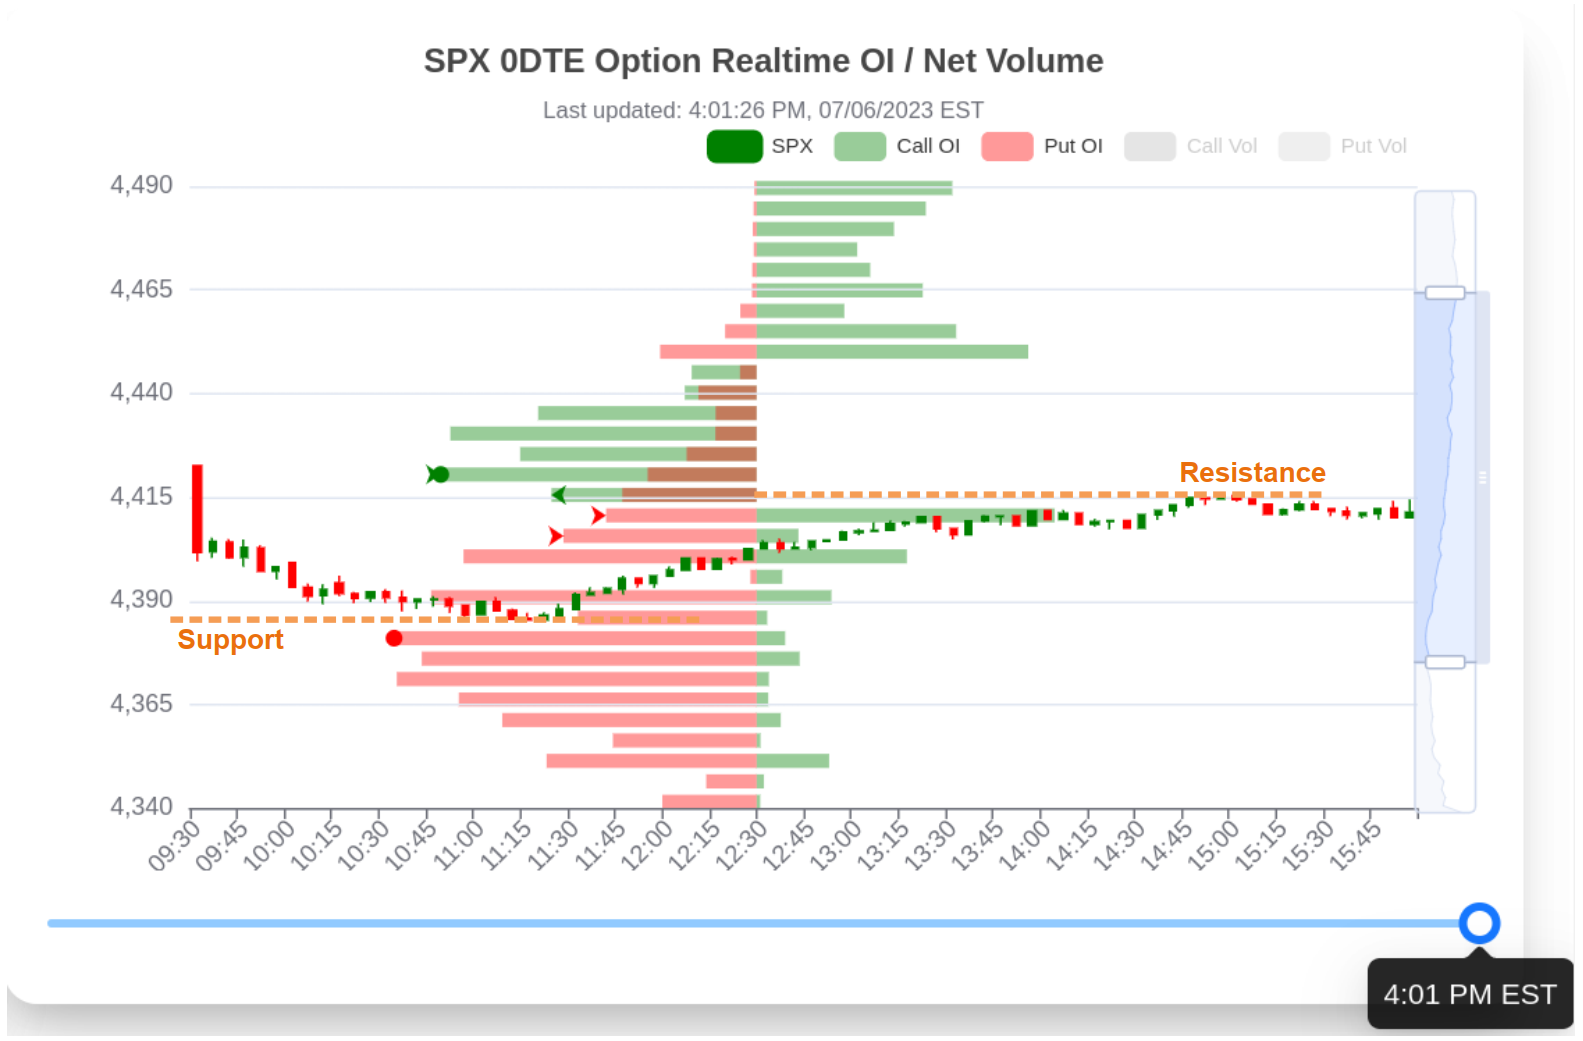
To make informed trading decisions, traders should also analyze the option flow and GEX data. This information, combined with extracted Support and Resistance levels, can be used to identify favorable opportunities for capturing momentum through long or short positions. By adhering to these guidelines, options traders can navigate market conditions more effectively, thus improving their trading outcomes.
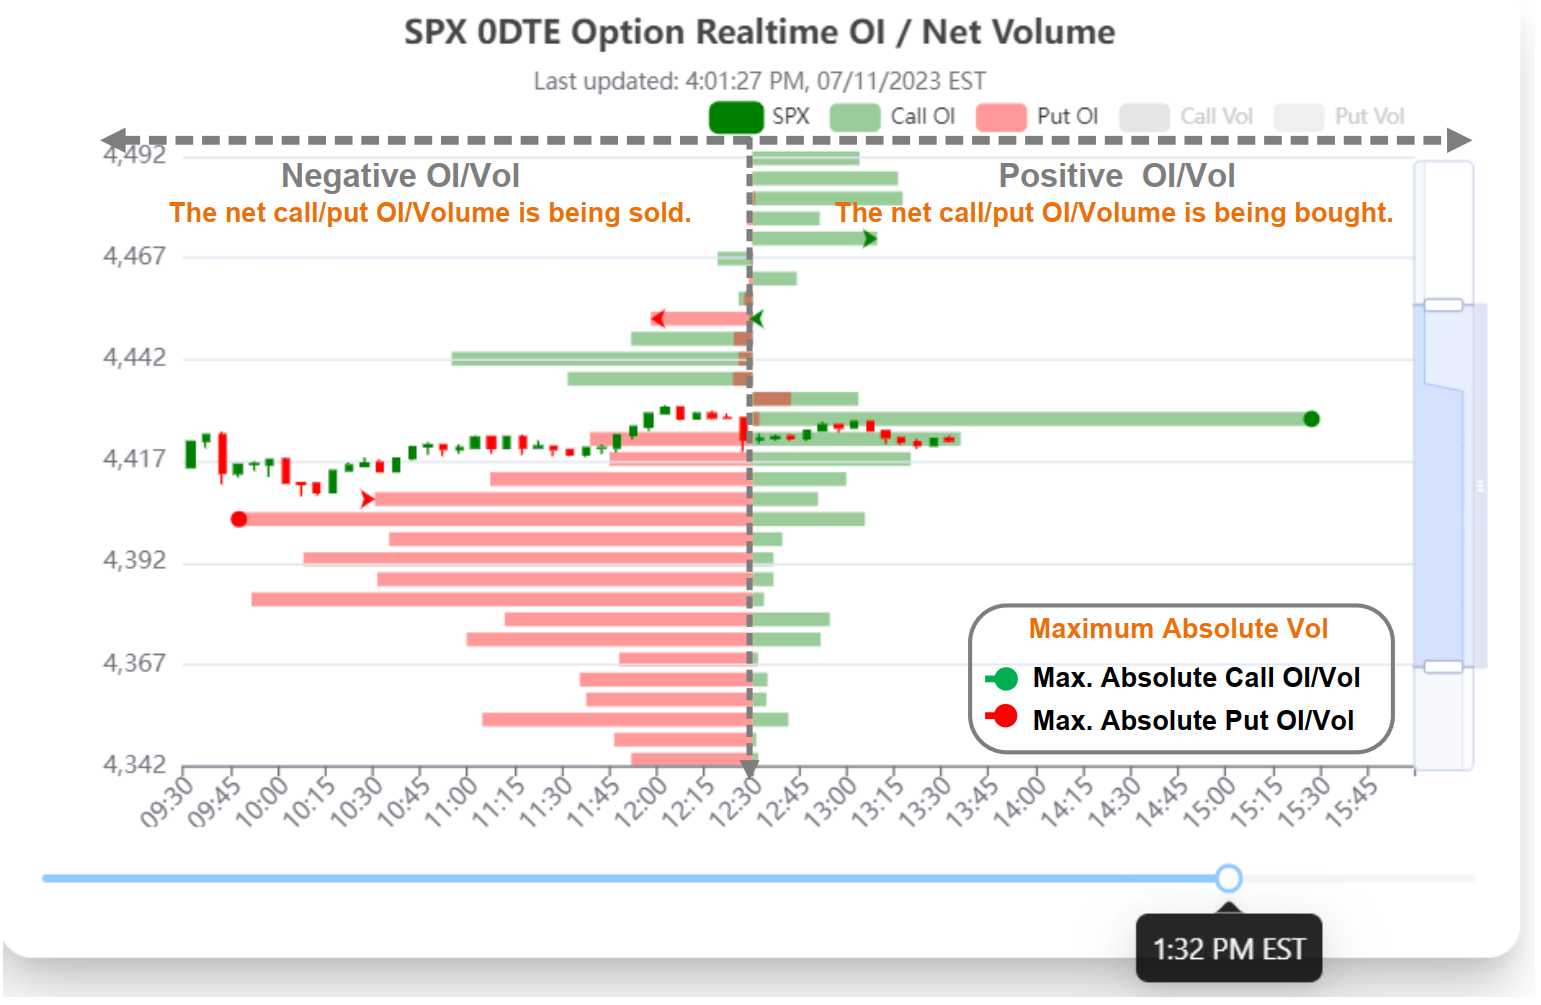
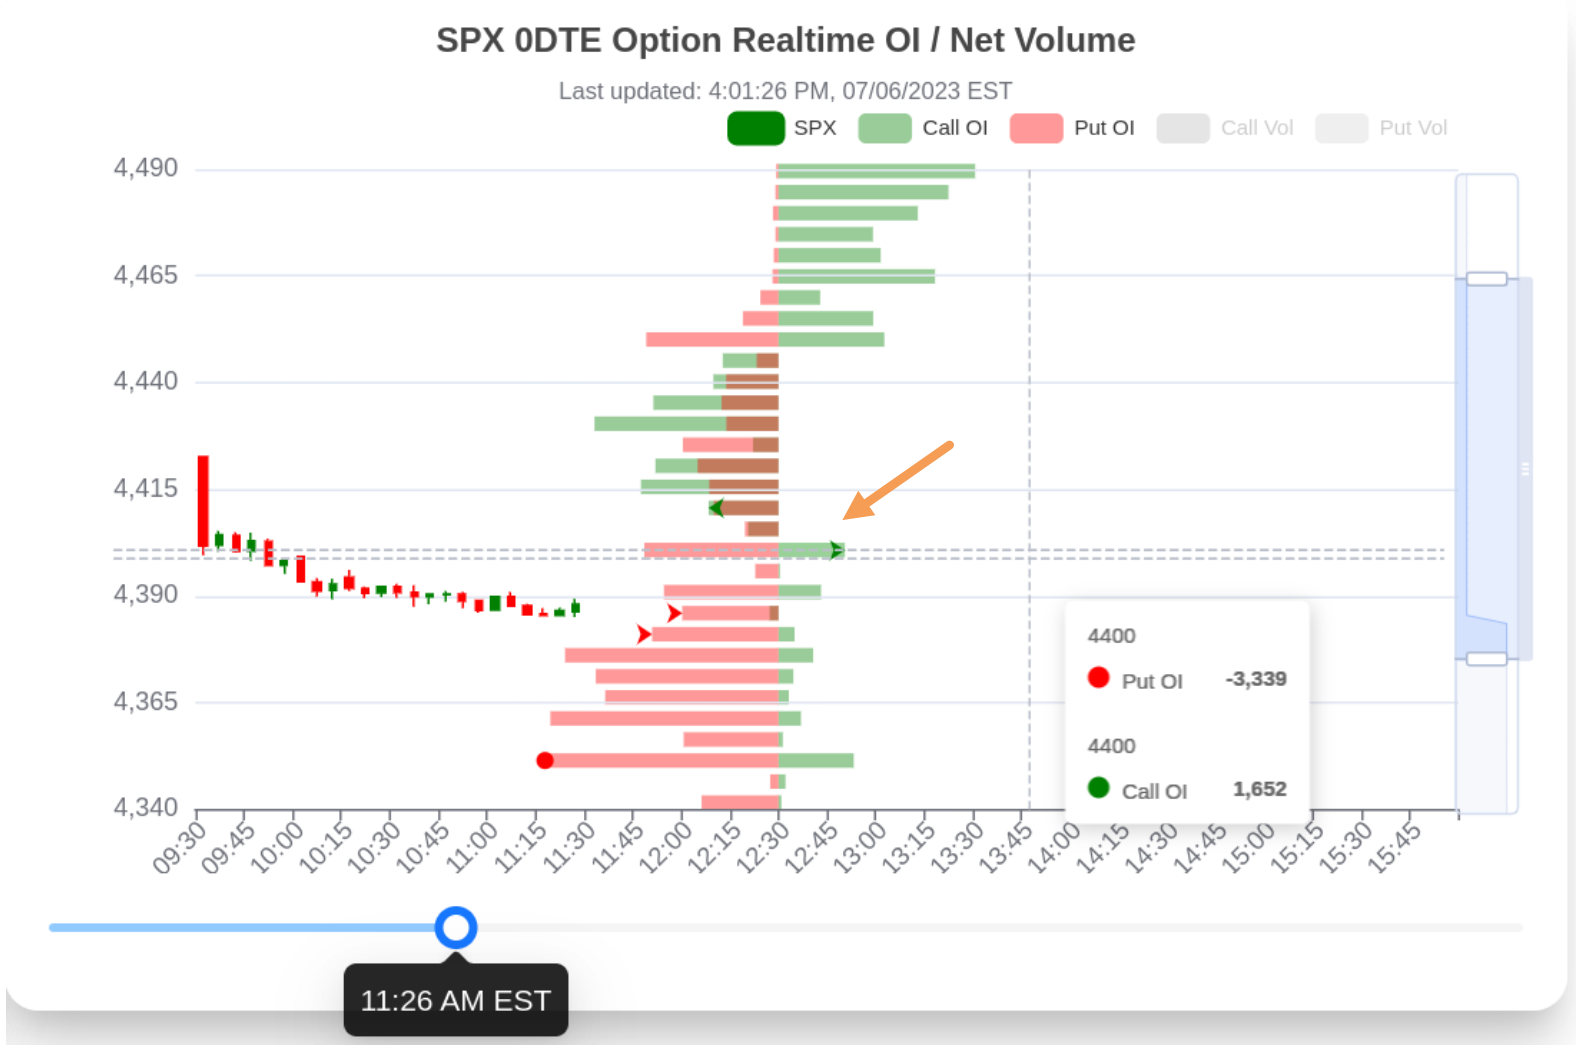
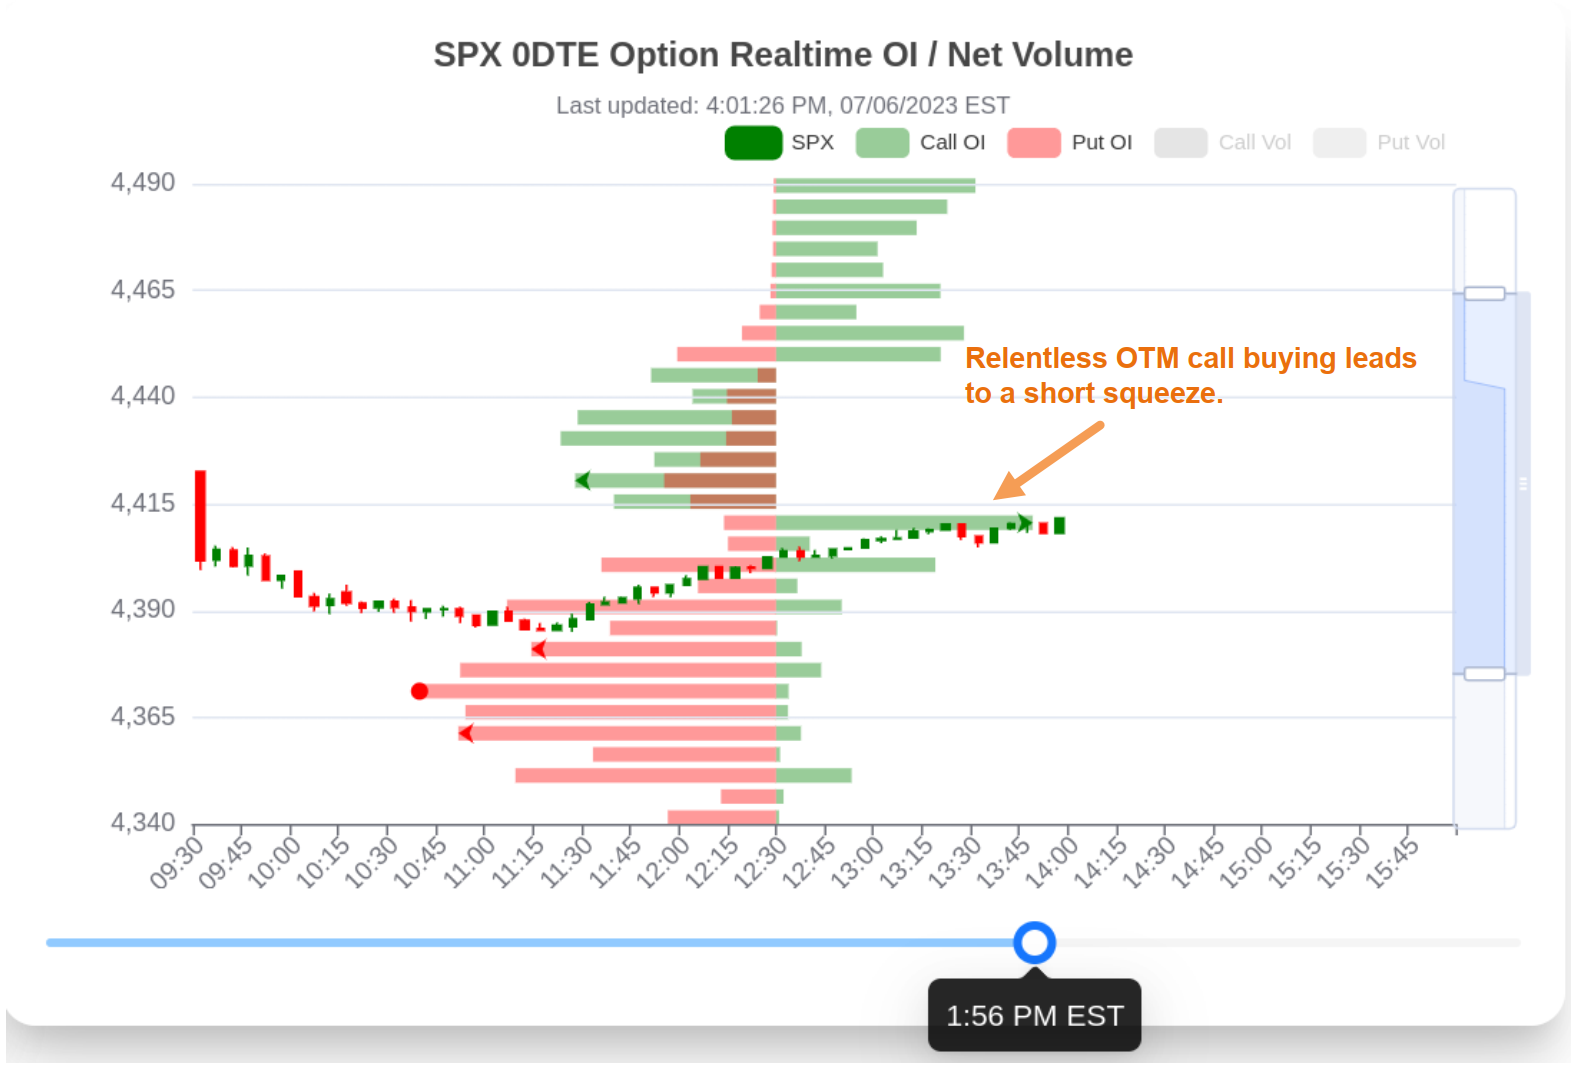
Realtime 0DTE Option Open-Interest Net Volume
The real-time traders' intraday 0DTE SPX option Open-Interest (OI) and volume offer another angle for sensing market trends. In the chart, the direction of the real-time traders' OI/Net volume has been categorized based on the algorithm, enabling us to identify buying/selling trends.
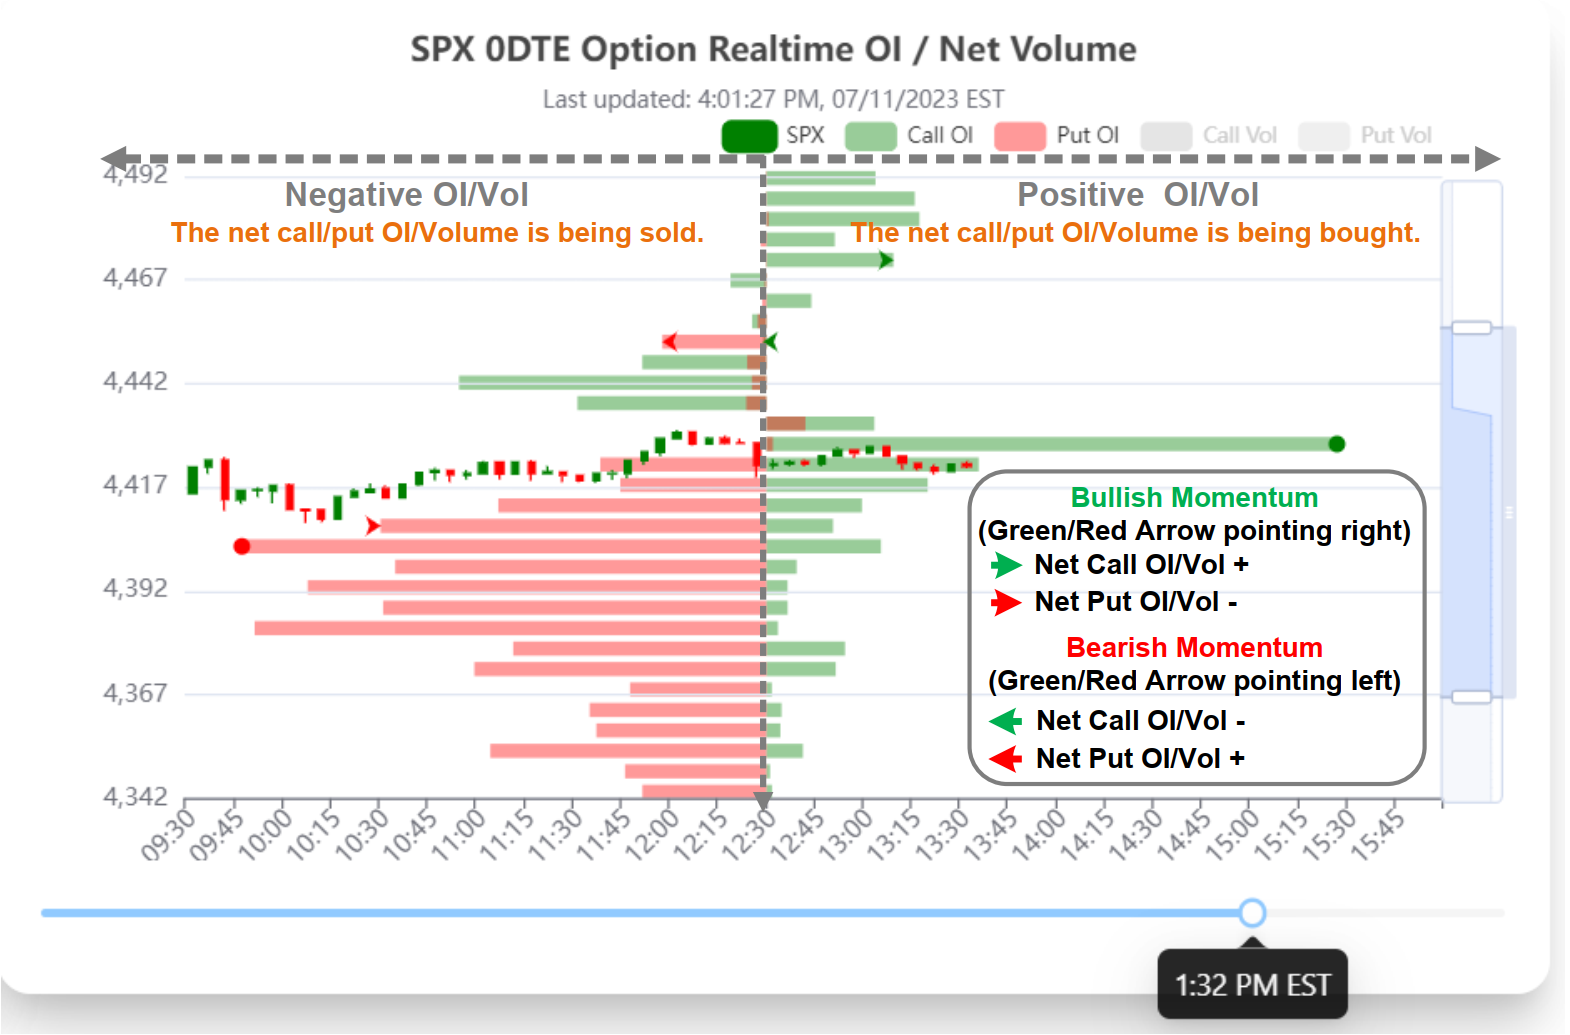
The green and red dot (•) symbols represent the strikes with the maximum absolute volume for Calls and Puts, respectively. The green and red arrows (→ or ←) indicate the strikes with the first and second largest volume changes. The direction of the arrow, regardless of whether it is green or red, signifies bullish momentum if pointing to the right side (→), and bearish momentum if pointing to the left side (←). We have marked OI/Volume across different strike prices, making this data effective for application in two different scenarios:
The 0DTE options trading has attracted increasing attention nowadays, sometimes accounting for more than 50% of total volume. To capture the dynamics behind this trend, we suggest checking the 0DTE option flow in conjunction with our intraday MSI to identify potential trading opportunities.
To gain access to comprehensive real-time 0DTE option OI/Volume data and more detailed information, we highly recommend considering a premium subscription. As valued users, a premium subscription will provide you with the tools and resources necessary for enhanced trading analysis and decision-making.
Gamma Exposure and Distribution
Gamma Exposure (GEX) reflects how an options portfolio responds to price shifts in the underlying asset. It's vital for major traders, offering a glimpse into how their positions might alter with changing market conditions.
Option positioning significantly impacts market dynamics. A large net long gamma position often leads to hedging, reducing market volatility. This is because traders with positive gamma exposure buy the underlying asset when its price falls and sell when it rises, ensuring price stability. However, a large net short gamma position can intensify market volatility. Traders with negative gamma exposure sell the underlying asset as its price falls and buy as it rises, which magnifies price swings.
- Our Dealer Gamma Exposure Plot displays the net Gamma across all strikes in relation to the assumed corresponding spot value. For example, when the spot value reaches the Gex Flip point, the net Gamma will be 0.
- Our Gamma Distribution presents the summarized Gamma multiplied by Open interest for all expirations, plotted against the specific strike at the current snapshot. Unlike the Gamma Exposure Plot, its x-axis represents the strike rather than the assumed spot value. The Gamma Distribution is valuable for identifying critical supports and resistances.
Monitoring GEX and option positioning helps predict market trends and manage risk. By examining option interest, prices, and strike price distributions, traders can understand the market's gamma exposure and refine their strategies.
Short Volume Ratio
Short Volume Ratio (SVR) measures the short sale volume data compared to total trading volume. The short sale volume, as published by the Financial Industry Regulatory Authority (FINRA), represents the aggregate daily amount of short sales (selling securities that are borrowed, usually with the expectation that the price will drop) traded in the market. This data does not include all trades, only those that are publicly disseminated, which can sometimes lead to the appearance of a high concentration of short sales relative to total volume.
Options Flow
- On the Intraday page, the options flow shows the most actively traded options in terms of volume during market hours in real-time, or the data from the previous trading day at market close. The spot price reflects the cost of the underlying asset at the point the trade took place. The trade type, as determined by our proprietary algorithm, implies whether the transaction was a 'buy' or a 'sell'. However, some trades may be too close or too noisy to definitively classify as either a buy or a sell, which will be designated as 'undecided'. You can use the search bar to find option flows for specific tickers. Simply enter the ticker symbol into the search bar and click the 'Search Option Flow' button. The table will then update to display only the options flow for that specific ticker. Please note that not all tickers may have significant options flow or large trades. It's possible that some tickers may have limited options activity. If you search for a ticker and no significant flow is found, or if the ticker entered is incorrect, the table will display a message indicating that no significant flow was found for the given ticker. To view the options flow for all tickers again, you can click the 'Reset' button. This will clear the search bar and refresh the table to display the options flow for all tickers.
- On the Daily page, you can select the stock name from the menu located at the top left corner. The table will then display the corresponding options flow for the ticker you have selected. The spot price reflects the cost of the underlying asset at the point the trade took place. The trade type, as determined by our proprietary algorithm, implies whether the transaction was a 'buy' or a 'sell'. However, some trades may be too close or too noisy to definitively classify as either a buy or a sell, which will be designated as 'undecided'. Please note that not all tickers may have significant options flow or large trades. It's possible that some tickers may have limited options activity. If you select a ticker and no significant flow is found, the table will display a message indicating that no significant flow was found for the given ticker.
In Ivergreen Capital, we focus on providing the best trading signals and alerts to our clients. We are a team of experienced traders and analysts who have been in the industry for over 10 years.
©2025 - Ivergreen Capital
Product
- Pricing
All information and materials provided by OptionsPro and Ivergreen Capital is for educational and informational purposes only and does not constitute financial advice or recommendations. Trading and investing involve substantial risk, and you should always do your own research and consult with a licensed financial advisor before making any investment decisions. By accessing this Website and/or App, you hereby consent to our Terms of Service and Privacy Policy.